


Product Mix - Margin Report
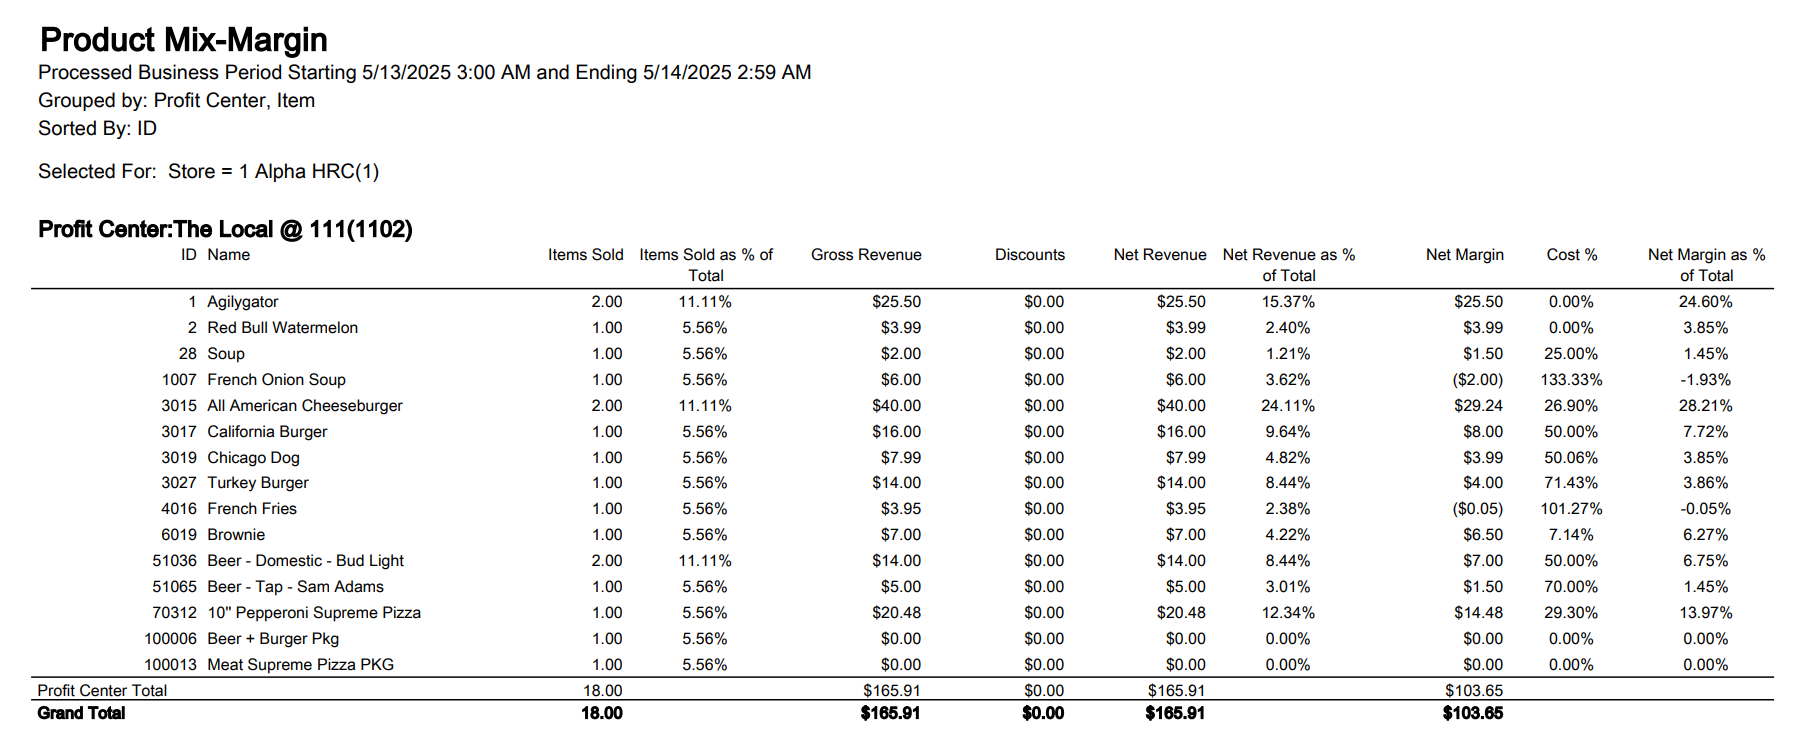
The Product Mix - Margin Report is for monitoring item margins and the quantity and revenue of items sold. Margin is the revenue left over after an item’s cost is subtracted from its sales price. Most operations know the theoretical (or expected) margin of an item based on its configured price and cost. The Product Mix - Margin Report helps management do things like increase the quantity of high-margin items sold, keep real margins as high as possible for specific items (by eliminating ineffective discounting and price reductions), or optimize the product mix to a better-margin mix (that is, increase the percentage of high-margin items sold). The Usage Scenario section introduces implementation details.
Usage Scenario
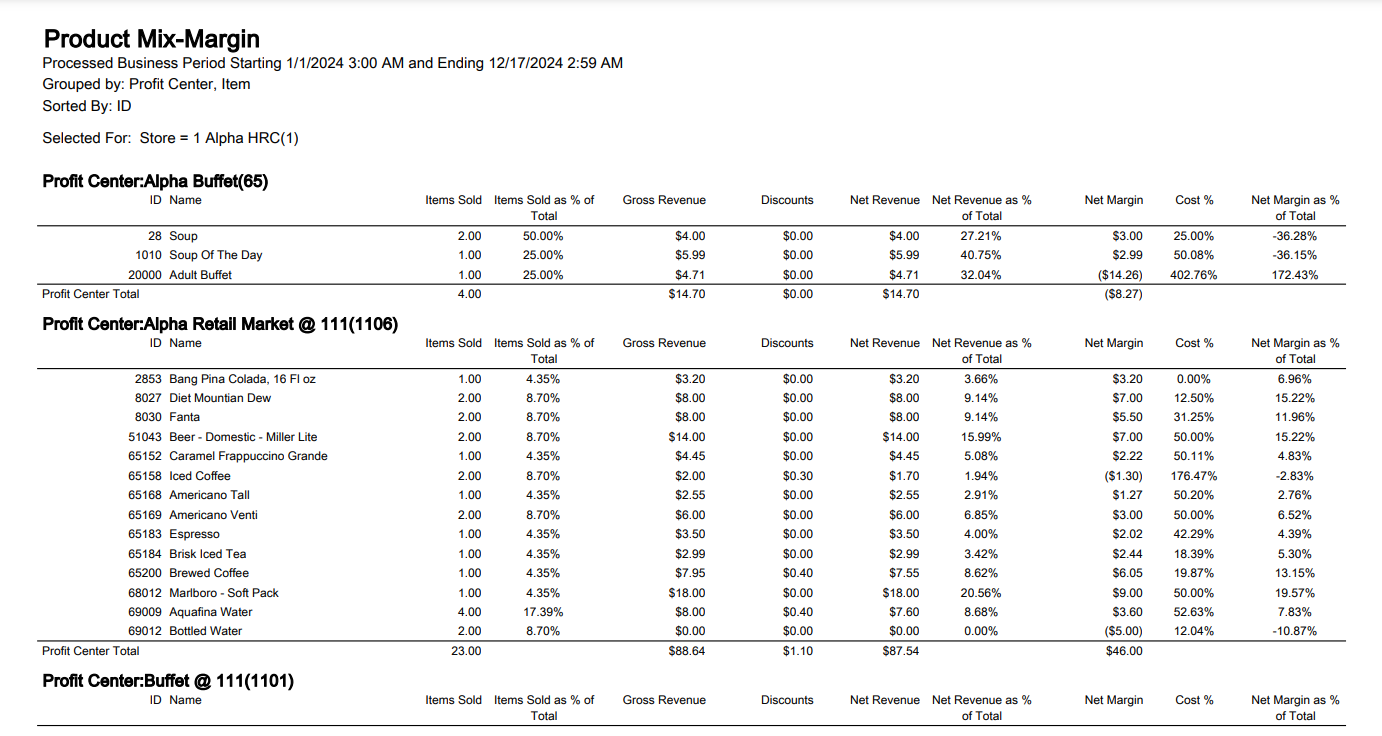
When real margins vary from an item’s expected (theoretical) margin, a problem likely exists. Especially when an item's real margin is less than the theoretical margin. To troubleshoot this problem, it is important to understand the reason for the variation. For example, variations between the expected margin and the actual margin can occur for any or all the following:
-
Manual price changes
-
Discounts on items
-
Voids, returns, and refunds
In the Product Mix - Margin Report, voids, returns, and refunds are removed as candidates for a variance. Only prices and discounts remain as drivers for a variance problem. The following example illustrates this concept.
A small profit center sells 100 hamburgers, and the manager of the profit center notices that the net margin of the 100 hamburgers is 47% instead of the expected 50%.
-
The manager knows that discounts are not the reason for the lower margin because the cash value of discounts given on the item Hamburgers is insignificant.
-
The manager believes that manual pricing changes may be the reason for the lower margin and confirms this by dividing the gross revenue for hamburgers sold by 100. As believed, the average price is far less than the configured price, indicating that cashiers are manually pricing hamburgers for less than their configured price.
-
The manager can also check to see if voids, returns, and refunds are the reason for the lower margin by viewing the items consumed for an item on the Product Mix - Revenue Report.
Quantity and Variance
Understanding of the Quantity and Variance relationship for items being sold within the operation is also important. Operations often categorize items depending on the Quantity/Variance relationship. For example:
-
Items categorized as high volume and high margin within an operation are often the focus of promotions, or the source for new menu ideas and offerings.
-
Items categorized as low volume and low margin within an operation are often considered for alteration, improvement, or removal from an operation's menu.
|
Field |
Description |
|---|---|
|
ID |
The ID of the appropriate item, product class, profit center, meal period, check type, report category or profit center group appearing on the report. This field depends on the grouping selections made when choosing the report. |
|
Name |
The name of the item, product class, profit center, meal period, check type, report category, or profit center group appearing on the report. This field depends on the grouping selections made when choosing the report. |
|
Items Sold |
The quantity of items sold. This is taken as the number of times the item is ordered at the terminal. The subtotal of this field includes all line item values whether they are zero, negative, or positive. |
|
Item Sold as % of Total |
Item Sold as % of Total = (items sold) ÷ (sum of all items sold). |
|
Gross Revenue |
The gross revenue for items sold after the calculation of refunds and returns. The subtotal of this field includes both positive and negative values. |
|
Discounts |
Total discount given on each item or product class. |
|
Net Revenue |
Net Revenue = (Gross Revenue) – (Discounts). The subtotal of this field includes all line item values whether they are zero, negative, or positive. |
|
Net Revenue as % of Total |
Net Revenue as % of Total = (Net Revenue) ÷ (sum of all Net Revenue values) |
|
Net Margin |
This field is calculated by subtracting the total cost of an item sold from the net revenue of the item. The subtotal of this field includes all line item values whether they are zero, negative, or positive. Net Margin Amount = (Net Revenue) – Cost |
|
Cost % |
Cost% = Total Revenue Cost Amt ¸ (Total Sales Gross Amount – Total Discount Amount) |
|
Net Margin as % of Total |
Net Margin as % of Total = (Net Margin) ¸ (sum of all Net Margin values) |
Product Mix Margin Report
|
Grouping Levels (3 possible) |
Sorting Choices |
Filters |
|---|---|---|
|
Profit Center * |
ID * |
Check Type |
|
Item (2) |
Discount Amount |
Meal Period |
|
Check Type |
Gross Revenue |
Profit Center |
|
Meal Period |
Item Sold |
Profit Center Group |
|
Product Class |
Items Sold % of Total Name |
Report Category |
|
Profit Center Group |
Net Margin Amount |
Server |
|
Report Category |
Net Margin as % of Total Net Revenue |
Store |
|
Server |
Net Revenue as % of Total |
|
|
* = default setting |