


Enterprise Revenue Summary Report
The Enterprise Revenue Summary report provides a summary of the revenue generated at an enterprise level.
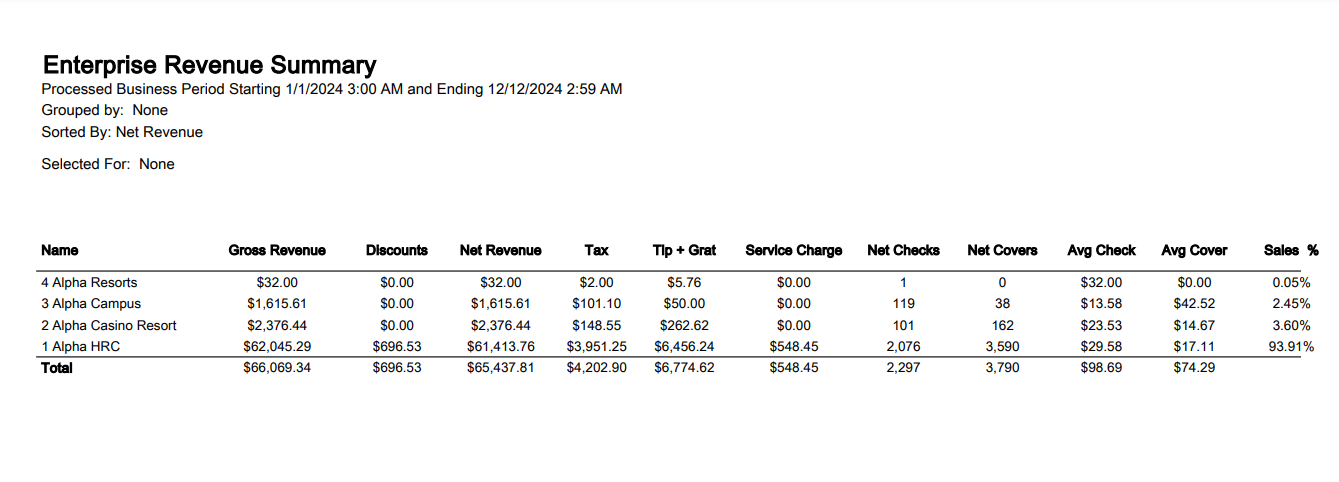
|
Field |
Description |
|---|---|
|
Name |
The name of the property. |
|
Gross Revenue |
The amount of revenue on the check prior to discounts, tax, tip, gratuity, and service charges calculated. |
|
Discounts |
The total discount given on each item or product class. |
|
Net Revenue |
Gross revenue minus discounts and taxes. |
|
Tax |
The total amount of all taxes received. |
|
Tip + Grat |
The amount of tips and gratuities. |
|
Service Charge |
The total amount of service charges. |
|
Net Checks |
Quantity of checks that were closed. Does not include refunded checks. |
|
Net Covers |
Quantity of covers that were on closed checks. Does not include refunded checks. |
|
Avg Check |
Net Revenue ¸ Number of Checks |
|
Avg Cover |
Net Revenue ¸ Number of Covers |
|
Sales % |
Percentage of sales revenue. |
It consists of the following sorting and grouping options:
|
Grouping Levels (3 possible) |
Sorting Choices |
Filters |
|---|---|---|
|
NA |
Gross Revenue |
Store |
|
Discounts |
||
|
Net Revenue |
||
|
Tax |
||
|
Tip+Grat |
||
|
Service Charge |
||
|
Net Checks |
||
|
Net Covers |
||
|
Average Checks |
|
|
|
Average Covers |
||
|
Sales % |
||
|
Store |
Summary
This section of the report provides a high-level summary of all transactions applicable to the selected parameters for the report, such as the report’s date range.
|
Field |
Description |
|---|---|
|
Gross Revenue |
The amount of revenue on the check minus the returns and refunds prior to discounts, tax, tip, gratuity, and service charges calculated. If an item is tax inclusive, the tax is not considered while calculating the gross revenue. |
|
Discounts |
Total amount of discounts on the checks. |
|
Net Revenue |
Gross revenue minus discounts and taxes. |
|
Tax Collected |
The sum of the tax collected. |
|
Gratuity: |
The dollar amount of all the gratuities calculated on the checks |
|
Service Charge |
The dollar amount of all the service charges calculated on the checks. |
|
Tips Collected |
The total tip amount collected. |
|
Total |
The sum of the net revenue, service charge, gratuity, and tax collected. |
|
Refund Amt |
The total refund amount. |
|
Return Item Amt |
The total value of all returned items. |
|
Gross Receipts |
Aggregate summary of all check total for a given period, not including refunds. Gross Receipts = Net Revenue + Taxes + Gratuities + Service Charges + Charged Tips |
|
Gross Revenue Outstanding* |
The sum of the gross revenue in the open checks. The revenue for the period in which this report is run is considered. |
|
Total # of Checks |
The quantity of the closed checks. |
|
Refund Checks |
The total number of checks containing a refund flag. Negative checks without a refund flag, (that is, those with returned items) are not included as refund checks. |
|
Net Checks |
The number of non-refunded checks. Net Checks = Total Checks – 2*Refund Checks |
|
Return Item Qty |
The sum of all the returned items. |
|
Void Amt |
The sum of all the void checks’ total. |
|
Void Qty |
The total number of checks voided. |
|
Avg./Check |
Net Revenue divided by the number of checks. |
|
Total Covers |
The total cover quantity of the net checks. |
|
Avg./Cover |
The average net revenue amount per net cover. |
|
Disc %: |
The percent of gross revenue given as a discount. If $100 of gross revenue is recorded, and $10 in discounts were applied by the cashier, the Discount % is 10% (100¸10). |
|
Discount Quantity: |
The total number of discounts applied on the check. |
|
No Sale Qty |
The number of No Sales performed by the cashier. Every time a cash drawer is opened without the check being tendered is considered a no-sale. A cashier usually does this to make change. The number of times this happens is displayed here. |
|
Cash Tender: |
The difference between the total tenders and the non-cash tenders. Cash Tender = Total tender – Non-Cash Tender |
|
Noncash Tenders |
The sum of the non-cash tenders. |
|
Loans: |
The total amount of all loans taken during the shift. |
|
Withdrawals |
Funds removed from the system via the Withdrawal function. |
|
Tips Paid Out |
The total amount of the tips paid out. Tip payouts are automatically subtracted from the current cashier’s accountable cash. |
|
Breakage |
The sum of the breakage amount across tenders. |
|
Change |
The sum of the change given out while tendering. |
|
Net Tenders |
The amount of all tenders (both cash and non-cash) after change, loans, withdrawals, and tips have been processed. |
|
Total Cash Drop |
The total cash drop amount. This value is updated after the Shift Reset function is performed. |
|
Accountable Cash |
The expected amount of physical cash tenders on hand that the cashier or server-banker is responsible for. Accountable cash = (Total Tenders – Change) + Loans – Withdrawals – Tips Paid – Non-cash Tenders |
|
Over/Short |
Amount of cash that is either missing from the drawer or is extra in the drawer. Over/Short = Cash Drop Amount – Accountable Cash |
|
Pending Tips |
The remaining tips available in the cash drawer after the tip payout. Pending tips = Tips paid out – Tips available in the cash drawer at the end of the business period. |
Sub Reports
The following sub-reports form the Sales Balance report:
-
Check type
-
Meal period
-
Tender
-
Gross sales, Tax & Discount
-
Job code summary
The following grouping and sorting options are available for this report:
|
Grouping Levels (1 possible) |
Sorting Choices |
Filters |
|---|---|---|
|
Store |
None |
Store |
|
|
Job Code |
|
|
Meal Period |
||
|
Check Type |